eCommerce managers and performance marketers are much more fortunate than their bricks and mortar predecessors: we have a world of data at our fingertips. And while numbers alone can’t tell us anything, eCommerce KPIs (informed by metrics) are a key ingredient to both measure and improve your performance.
In this article, we’re sharing the whole recipe.

What are eCommerce metrics and KPIs, and what’s the difference?
Metrics are a system of measurement that are (usually) expressed numerically.
With the right metrics (also called KPIs in this context) you can know:
- where your customers come from
- how they get to your store
- what they’re looking for, and what they ultimately look at
- when they decide to purchase (or not)
- and a lot more
But more important than the metrics themselves is having an accompanying strategy. That will tell you what to track, and, most importantly, what they suggest about the performance of your site.
When you add strategy to your metrics, they become KPIs, or key performance indicators. They’re aptly named since they do just that: they define the metrics that are key to indicating your brand’s performance. That means KPIs are likely to include metrics, but that not all metrics are necessarily KPIs.
For example, if your focus for Q1 is on conversion rate optimization (CRO), session duration is an available metric that is unlikely to be a KPI. In this context, session duration has no direct connection to achieving your goal.
Just as not all metrics are KPIs, not all KPIs involve (quantitative) metrics or even numbers. Performance marketers may shutter at the thought that some things escape the measurability of actual numbers. But there are other, more qualitative methods of measuring performance too.
We’ve so far discussed “improving performance”, but in the context of eCommerce we can be much more precise. Improving the performance of an eCommerce website generally means achieving: an increase in sales, an increase in profit, or both.
Why is tracking eCommerce KPIs important?
-
Measuring performance against your own set goals.
This is a bit redundant, as this is the core purpose of KPIs, but if goals are important than so is measuring them and tracking them properly. Identifying a set of KPIs can tell you, quickly, how well your site is performing in terms of sales and profit– and more specific set sub-goals.
For example, as a marketing goal, you may want to increase visits from organic social because you have observed that these visits have a higher conversion rate, so doing so would be an efficient way to increase sales.
A perennial hot topic. Without benchmarking your eCommerce KPIs, you can only know how you’re performing according to your own (absolute) figures. That means you can determine if your website is profitable and if your marketing strategy is generally “working”.
But what if you want to know if your performance could be better, and by how much?
For a more precise understanding of your weak and strong points as well as your growth potential, you need to know the eCommerce metrics of your competitors.
If eCommerce metrics and KPIs beg the question, then eCommerce benchmarking provides the answer. Like, what is a “good” AOV?
What you really need to know is what’s the average AOV for eCommerce stores in my industry. Benchmarking means comparing your KPIs to others’ so that you can situate your own performance– above or below standard.
Is your performance better or worse than your competitors’? Benchmark your eCommerce performance against others’ in your industry now, for free, with Grips Benchmarking.
-
For prioritization and data-backed decision-making.
Benchmarking KPIs can also help you to prioritize your action items. If your bounce rate is best-in-class, you may want to focus on more urgent areas for improvement. And, prioritization will ensure your resources are not wasted.
Regarding more informed decision-making, KPIs give your intuition a break and take the guesswork out of optimization.
For example, if you’re torn on call-to-action copy, comparing click-through rates (or CTRs) can tell you which is performs better.
-
To chart long-term growth.
Finally, how will you know how far you’ve come if you don’t know where you started from? And, which steps in between brought you forward and which missteps held you back?
A growth strategy by definition requires an accurate understanding of where you stand along the way. Ultimately, if you don’t understand the outcomes of your strategies, you can’t tailor them for bigger and better results. Consistently evaluating and responding to your KPIs enables you to stay on the right path for growth.
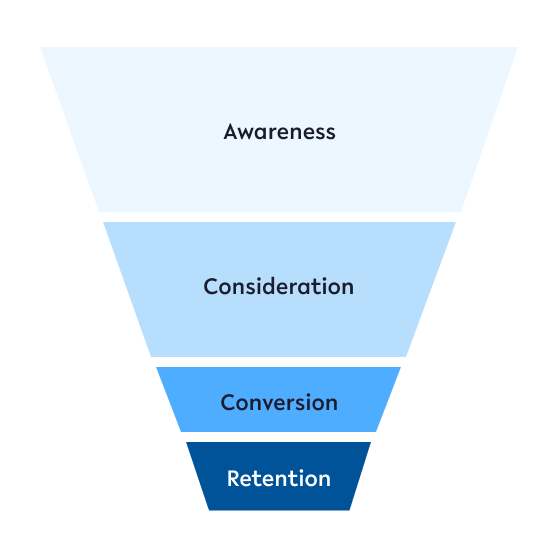
8 eCommerce KPIs to track for a full funnel strategy
Many marketers find the funnel to be a helpful analogy for tracking the consumer journey, so we’ll use that model here.
If you haven’t employed a marketing funnel before, consider this your crash course: the shape charts the customer journey toward the intended goal (conversion).
An effective eCommerce marketing strategy loses fewer shoppers along the way– turning a higher proportion of prospective buyers into customers, then evangelists.
-
Sessions
Why is it useful to track sessions–and how can they be increased?
The following sources tend to make up the bulk of sessions for eCommerce sites, but this varies quite a bit based on industry.
- Direct sessions – Brand awareness marketing campaigns, including offline marketing
- Paid search – Optimizing your Google Ads
- Organic search – Improving your SEO and website content
- Social – Including high quality content with compelling CTAs or clickable content links on your social platforms
- Email – Including compelling CTAs and high quality clickable content in your email campaigns and newsletters
There are a number of ways to look at sessions to your eCommerce site, but overall, they are a measure of success, or KPI, for your awareness and consideration strategies.Depending on your industry and marketing mix, you may also want to track sessions from:
- Affiliates
- Referral
- Other advertising
- Display
In all cases, increasing sessions by source means getting more clicks on your content– with an important caveat: not at any cost. You only want to have more sessions if they are meaningful, i.e. if they are likely to result in a sale. It can be tricky to define which sessions are “meaningful” but one way to measure is with on-site activity. In particular:
2. Bounce rate

Bounce rate is a weighted metric that defines the percentage of visitors who exit your site after viewing only one page
Why is it useful to track bounce rate–and how can it be decreased?
Typically, a high eCommerce bounce rate could indicate that something isn’t quite right for your visitors.
It might be helpful to you to use bounce rate as a shorthand KPI for interest, or more accurately, lack thereof, in your site. Ask yourself how often have you landed on an eCommerce site you were interested in but failed to view more than a single page.
If your bounce rate is high, it’s worth investigating why. the longer people stay on your site, the more familiar they get with your brand and its offerings, and the more likely they are to convert.
If after auditing the basics, you are still scratching your head, it’s worth diving into possible reasons why by having a closer look at user behavior.
You may also consider pages per session a meaningful traffic KPI to gauge users’ interest. However, we won’t dive into that metric in detail here because optimizing your site to increase pages per session is not always a good thing: you don’t want to encourage users to browse multiple pages when fewer would be more efficient.
This highlights an important point about metrics and optimization: it’s important to look at the big picture and consider performance holistically or at least in the context of other KPIs. When we hyper focus on individual metrics, we may miss the forest for the trees.
For example, if you want to increase your ad performance by enhancing click-through rate, you may include a more flattering (even deceptive) image of your product. However, those clicks will only cost you when users bounce, not finding what they expected on your landing page.
Optimize conversion: sales and profit KPIs
3. Conversion rate

Conversion rate % = total number of conversions (sales)* / total sessions x 100
*In eCommerce, “conversions” are sometimes used interchangeably with “sales” since sales tend to be the primary goal of eCommerce sites. But conversions can be set to track (almost) any “goal”, such as sign-ups or form submissions. For the purpose of this article, we’ll assume that conversions are set as sale completion.
Forget “cash”: in eCommerce, conversion rate is king.
Conversion rate is a weighted metric that shows the percentage of total visitors on your eCommerce store that are “converting”— making a purchase.
This metric bridges the gap between website traffic and sales. It shows how effective your website is at encouraging visitors to take action or literally the rate at which users convert. A higher conversion rate means you don’t need to get as much traffic to yield the same number of sales.
Conversely, a low conversion rate points to inefficiency in your sales funnel, suggesting sales opportunities (i.e. visits to your site) are not being converted to sales as often as they should. It is possible to have high conversions (or sales) and a low conversion rate.
For example, Black Friday may be the day with the highest sales for the year– driving conversions through the roof. But, if compared to the relatively high volume of visitors on that day only a small percentage of users made a purchase, that would result in a low conversion rate.
And, more visitors to your eCommerce website is likely to increase conversions, but unlikely to have an effect on the conversion rate.
Why is it useful to track conversion rate–and how can it be increased?
Conversion rate is a shorthand for the effectiveness of your eCommerce website as a sales tool and points to the overall efficiency of your marketing funnel. A high conversion rate validates that you are reaching the right audience– because they’re purchasing your product. And, because it doesn’t depend on increasing your volume, improving your conversion rate is the best way to quickly increase your sales.
Since we can assume the user is interested in a product like yours and that they accept the price and basic listing information (shown on the ad or listing), we can narrow our focus a bit.
Also called conversion rate optimization, or CRO, here are a few quick tips to get you started on improving this eCommerce KPI or eliminating the obstacles to purchase. Here are some tips:
- Find and fix technical issues such as slow page loading time or a buggy checkout process
- Audit your purchasing page UX: it’s possible users aren’t sure how to proceed with a purchase. Even a brief moment of confusion could dissuade a prospect from completing their purchase
- Include many high-quality images. Consider investing in a product video and lifestyle images. Provide detailed product descriptions and include the answers to common questions about the product
- Improve your store’s credibility with social proof in the form of customer reviews, an SSL certificate, and data policies
- Craft benefit-oriented calls to action (CTA) copy including things like “free shipping”, “no sign-up required”, “limited-time offer” to reduce friction and sweeten the deal
Ultimately, not every user will convert and it’s normal to browse, but you want to make sure that you’ve made the process as simple and as transparent as possible for those who are interested.
4. Transactions (or conversions)
If conversions are set to sale completions, then the number of conversions/transactions is the volume metric counterpart to conversion rate. Simply: the total number of conversions.
Why is it useful to track transactions–and how can they be increased?
In the context of eCommerce KPIs, transactions (or conversions) are sales, so the case for tracking them is self-evident. But how is it different from tracking conversion rate?
Well, you can increase transactions by improving your conversion rate, but you can also increase the number of transactions by increasing volume. Or, widening the top of your marketing funnel.
Of course, there’s no silver bullet to increasing sales– this is likely to be the collective goal of your entire marketing strategy. So, we won’t dive into too much detail on how to achieve that here.
However, one of the lowest hanging fruits for increasing the volume of transactions is to increase the frequency of transactions from your existing customer base. Here are some tips:
-
-
- Introduce special offers and sales through social campaigns and newsletters
- Consider a loyalty or reward program
- Keep your product selection fresh, and stay informed of what your consumers want. Consider stocking accessories or consumables
- Nurture engagement with your customer base with fresh content, distributed through social and newsletter platforms
-
Ultimately, increasing the number of transactions from your existing customer base goes hand-in-hand with listening to your customer and investing in customer satisfaction. More on that in a moment.
5. Average order value

For the purpose of this article, we assume conversions are assigned to transactions, but this isn’t always the case.
AOV or average order value measures the average amount of money your customers spend per order. For example, if you made $100 from four sales in one day, then your AOV is $25.
Why is it useful to track average order value–and how can it be increased?
Conversion rate, transactions, and average order value are the eCommerce KPI trifecta of boosting revenue. Like conversion rate, increasing average order value can increase your eCommerce profitability without having to increase volume.
And, the greater your AOV, the more you can spend to acquire a new customer.
-
-
- Make sure your pricing strategy is sound and fits into the competitive landscape. Too high and you’ll risk decreasing transactions. Too low and your AOV could suffer
- Increase basket size with upselling and cross-selling marketing initiatives
- Consider offering incentives (like free shipping) by spend threshold.
-
Optimize retention: customer satisfaction KPIs
6. Session duration

Average session duration is the average amount of time that users spend on your website.
Why is it useful to track session duration–and how can it be increased?
Essentially, session duration is bounce rate’s “good” twin. If bounce rate should be low, then session duration should be high. As such, decreasing bounce rate and increasing session duration have similar solutions.
Optimizing for this KPI assumes that more time on your site means more interest in your site, and that more interest in your site means a greater likelihood of purchase and, especially, repeat purchases.
But, as we covered earlier (regarding pages per session) this is not necessarily a one-to-one. So while it is certainly a relevant data point, this metric should be taken with a grain of salt.
Increasing session duration in a meaningful way comes down to making the experience of being on your website more pleasant for the prospective consumer and keeping maintaining their interest. That’s much easier said than done.
Beyond the basics (see: decreasing bounce rate) here are some ways to encourage session duration in a way that stands to improve customer satisfaction.
-
-
- Include rich content, like videos and high-quality images to capture the attention of your audience.If it’s relevant, consider adding a blog to stoke inspiration and education about your product
- Audit your UX to make sure users intuitively understand how to navigate your site.Create linking redundancies: this might sound counterintuitive, but users should have many options to navigate your website
- Encourage browsing with cross-promotion
-
7. Customer ratings (and reviews)
Customer ratings are a number score assigned by the (usually) verified purchasers only, stating their overall satisfaction with the product purchased– usually on a scale of one to five.
We tend to think of ratings as the quantification of customer satisfaction. Reviews are the qualitative measure of customer experience that typically accompany ratings, in text format.
While both ratings and reviews are usually intended to be specific to the product, anyone who’s read a few understands that it’s not uncommon for users to get creative; that the overall buying experience is likely to have a significant impact.
There are two main ways to optimize reviews: increasing your average review score and increasing the number of reviews.
We all know how to improve the first, and there’s no way around it: providing exceptional customer service and a quality product is the best way to avoid negative reviews and encourage a high review score from your customers.
However, perfectly satisfied customers are less likely to leave reviews, while dissatisfied customers are much more likely to do so. That unfortunate fact can negatively skew your products rating, which can have a powerful impact on conversion rate. But, how can you encourage your customers to leave reviews?
-
-
- Incentivizing reviews can feel a bit like bribery, but a simple friendly reminder goes a long way. And, like anything you want users to do, you should make this as easy as possible
- Keep communication lines open, making it easy for customers to contact you with a problem. Many leave a bad rating or review as a last resort. Where possible, right the wrong that encouraged your customer to leave a poor review. When not, consider whether the feedback provided can help you improve your product or offering
- Be sure that your product is depicted as accurately as possible, with plenty of rich product information
-
The same tips can reduce return rate. You never want to make a sale at the expense of customer satisfaction, this will only cost you more in the long run.
You might have noticed a lot of the common challenges and solutions individual KPIs face are similar, and that’s for good reason. Increasing engagement and revenue is about listening to your customer and improving their overall experience with your brand.
Optimize: overall efficiency and performance
8. Revenue
Finally, a performance indicator that needs no introduction. Of course, any business will have a close eye on revenue. But in the context of eCommerce KPIs, it might be helpful to think of revenue as a litmus test for your marketing funnel. Since both primary goals of eCommerce, increasing sales and increasing profit, culminate in an increase in revenue, it is both a goal and an eCommerce KPI. More on that:
If your revenue is suffering, your KPIs can reveal why. Finding the weak points in your metrics will reveal the holes in your marketing funnel. For instance:
-
-
- Are you failing to bring in enough traffic, resulting in a low volume of prospects?
- Is your website content not compelling enough, resulting in wasted leads?
- Does your product disappoint, causing costly returns and negative reviews?
-
Conversely, optimization at each step should be validated by an overall increase in revenue– suggesting that your strategy is “working”.
Summary and key takeaways
In sum, your eCommerce goals and overall strategy will determine which metrics are considered key performance indicators. And while the selection will vary depending on your specific strategy, the following seven are fundamental:
-
-
- Sessions
- Bounce rate
- Conversion rate
- Transactions
- Average order value
- Session duration
- Customer ratings
-
That means tracking and optimizing each of these is the recipe for an increase in the ultimate KPI of (increasing):
-
-
- Revenue.
-
In addition, tracking eCommerce KPIs will allow you to:
-
-
- measure your performance against your own set goals.
- benchmark your eCommerce performance, so that you understand your strengths, weaknesses and potential for improvement.
- prioritize and make data-backed decisions.
- chart long-term growth.
-
If you’re curious to know where you stand in key eCommerce KPIs, you can now try Grips Benchmarking for free to unlock a dashboard comparing your own performance to your industry peers’.