Consumers globally are facing the highest prices they have faced in a generation. A number of factors are at play, which is exacerbating what is termed ‘the cost-of-living crisis’. Both consumers and businesses are being affected. There is a perfect storm of inflationary pressures, supply chain and labor shortages and rising energy and food prices. All coming together to fuel record inflation rates.
The UK has been one of the worst hit economies in the G20. The country is experiencing the highest inflation rate in the G7 group of economies, hitting a 40-year high of 9% with that number expected to climb even further in the coming months. And, there is a real fear that the country may enter recession this year, according to economic think-tank NIESR.
We looked at 61.8m eCommerce transactions in the UK over a six-month period (November 14th 2021 – May 14th 2022). We then compared the data to the previous year (November 14th 2020 – May 14th 2021), to identify any trends that showcased a potential slowdown in consumer behavior.
Here is what we found:
Consumers spend more on basic necessities, but buy less
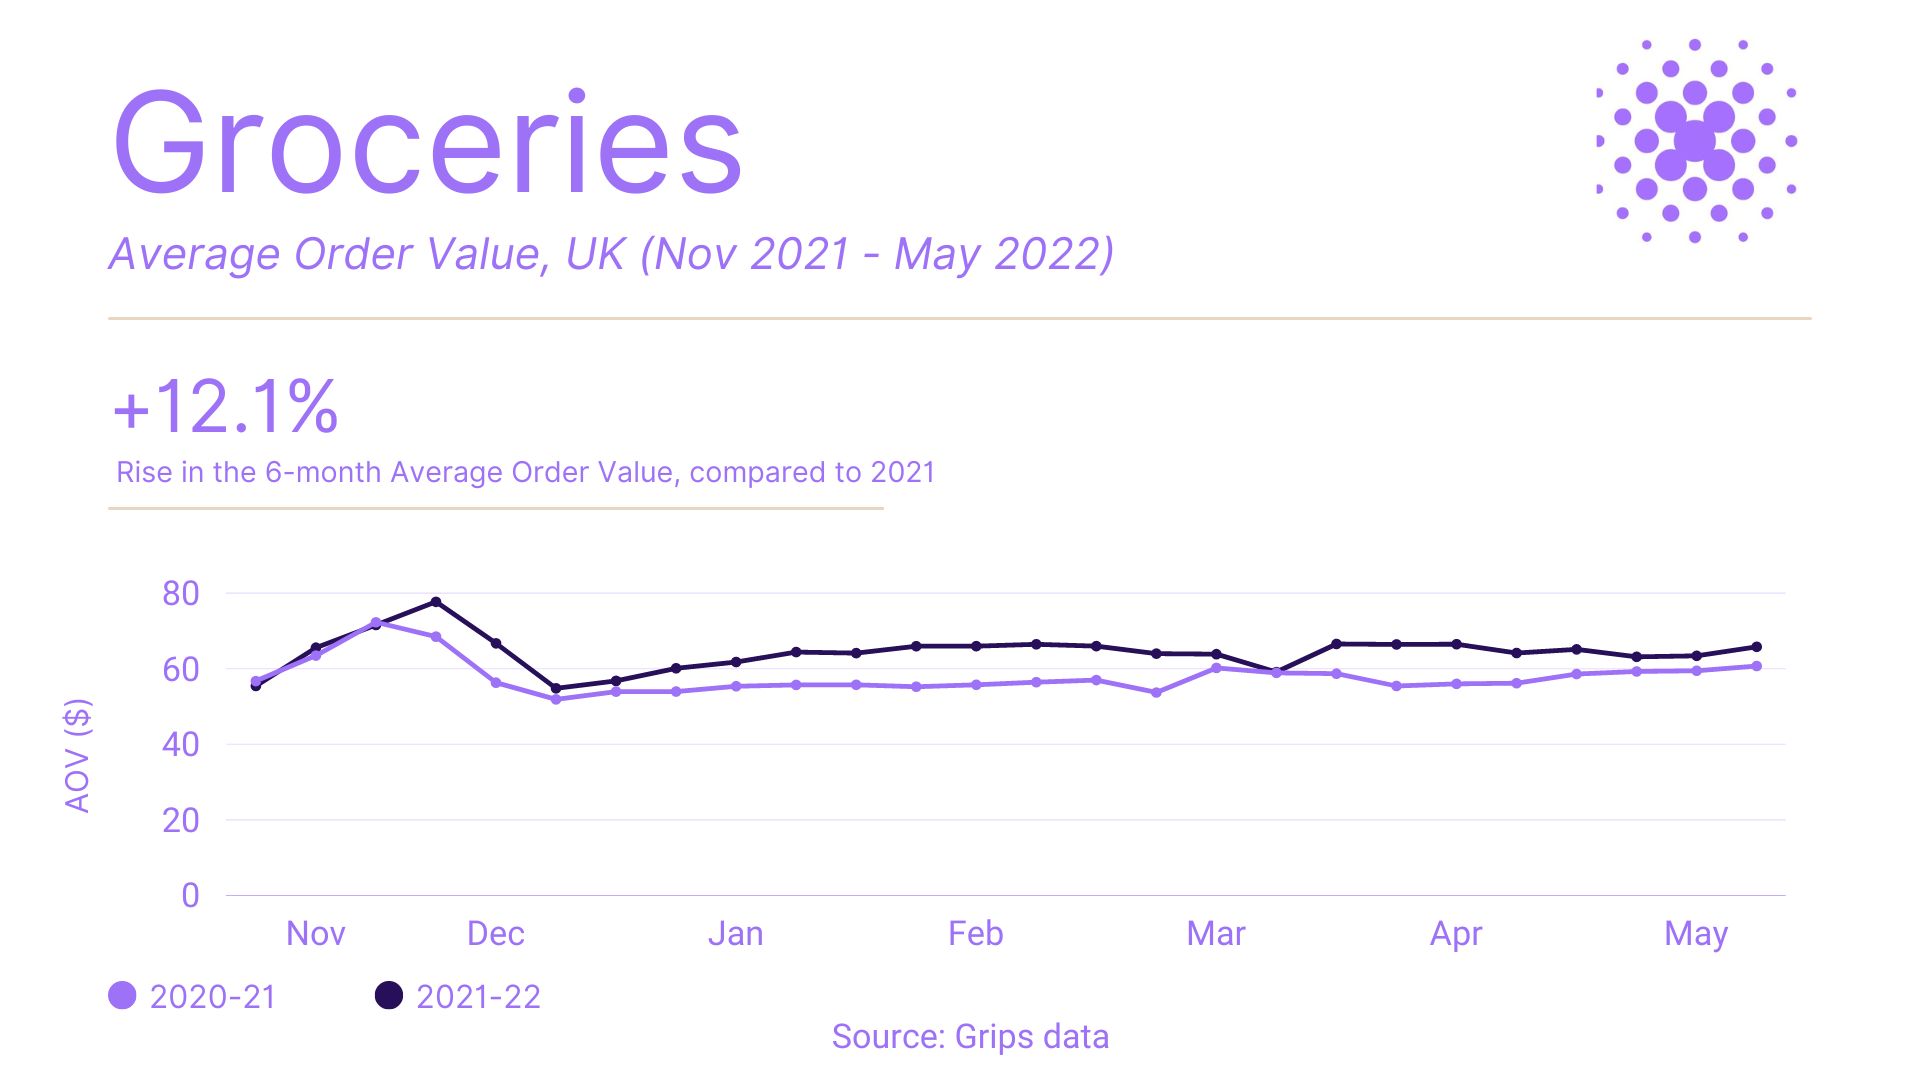
Over the last six months, inflation in the UK has almost doubled. We looked at the eCommerce impact for consumers on two categories of basic necessities – Food & Drink and Health.
As inflation started to rise significantly in 2022, we saw a 12.1% rise in the 6-month average in the Average Order Value (AOV), when compared to 2021 in both categories – Health’s AOV increased by 10.3% during the period and the Grocery category grew by 12.1%. Typically, AOV rises indicate a positive for eCommerce companies, as basket values are increasing. But, not in this case.
With wage growth falling behind inflation, the rise in AOV cannot be viewed in isolation. Products have grown more expensive. To get the full story, we looked at two other eCommerce metrics: Transactions and Conversion Rate.
The first metric we explored was the Conversion Rate. The metric measures the number of conversions divided by the number of visitors to a website. It helps build a fuller understanding of why there has been a double-digit increase in AOV, despite the cost-of-living squeeze in the UK.
In the Grocery category, we saw quite a substantial drop in conversion rates over the 6-month period – it dropped from 8.1% to 7.1%. Conversely, in the Health category, over the same period – the conversion rate actually increased rather substantially from 1.8% to 2.3%. The UK experienced its coldest winter in over a decade during the period we measured, which may have increased the demand for medicine. We saw this in our data with an increase in sessions between November and into December.
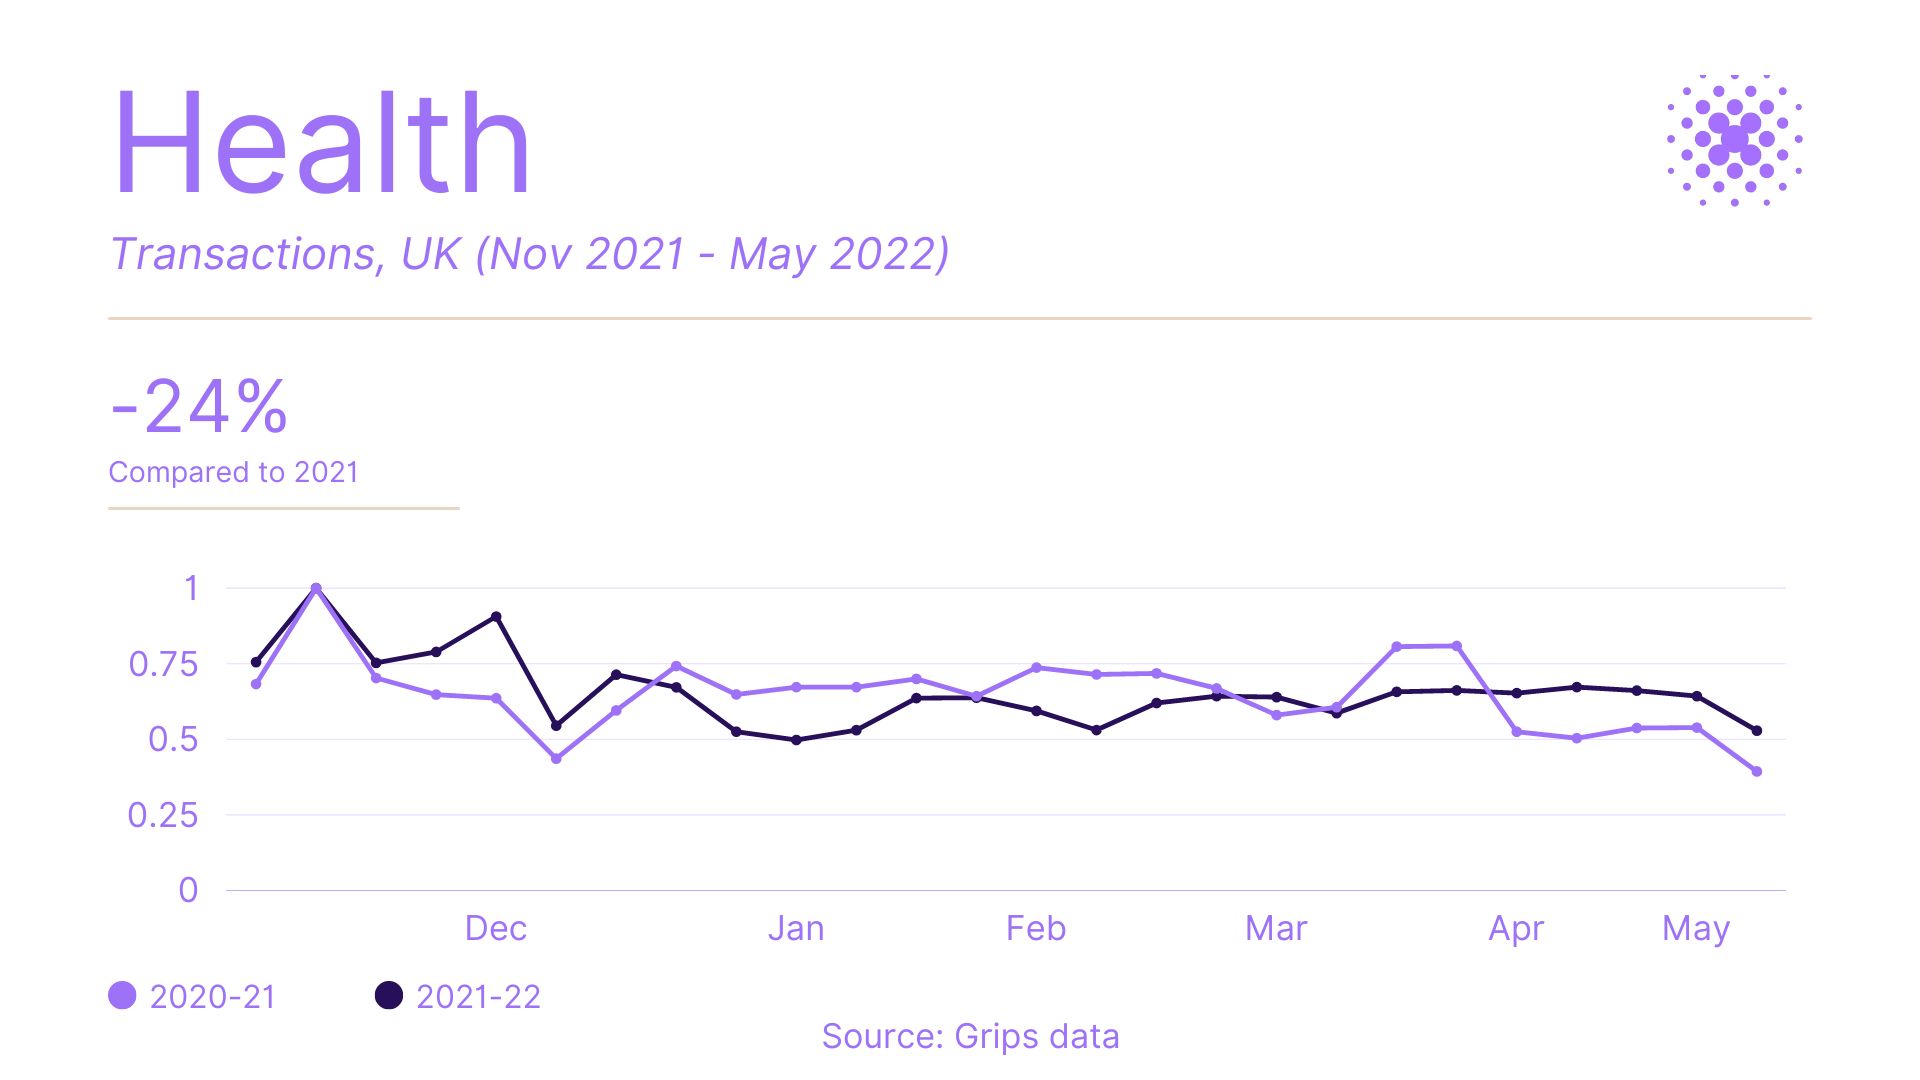
However, it is not quite such good news for Health retailers once we add in the Transactions metric, which represents the number of unique orders in an online store. This is when we see how the cost-of-living crisis affected sales in the industry. People spent more on Health products like medicine during the six months period that we measured. Inflationary price rises could explain this, causing consumers to buy less products, despite the higher AOV. Our data showed an average 24% decline in transactions compared to the previous year, despite the cold weather.
There was even worse news for the eCommerce departments of Grocery shops. Transactions shrunk by a substantial 42%, which included the Christmas period. One possible explanation for the reduction, could be down to shoppers preferring to do their grocery shopping in-store, as the cost-of-living crisis took hold. This may explain the higher basket values, but with fewer consumers buying online.
Consumer save on non-essential items
With products seen as consumer staples seeing a decrease in transactions. It is perhaps unsurprising that our data highlights a reduction in consumer spending on discretionary products (goods not seen as necessary, e.g. furniture, clothing, sports equipment, etc.).
Our data has shown that Home and Garden retailers have been particularly affected by the cost-of-living squeeze, as households begin to prioritize their spending. Transactions in the category fell by 50% between November 2021 and May 2022, when compared to the previous year.
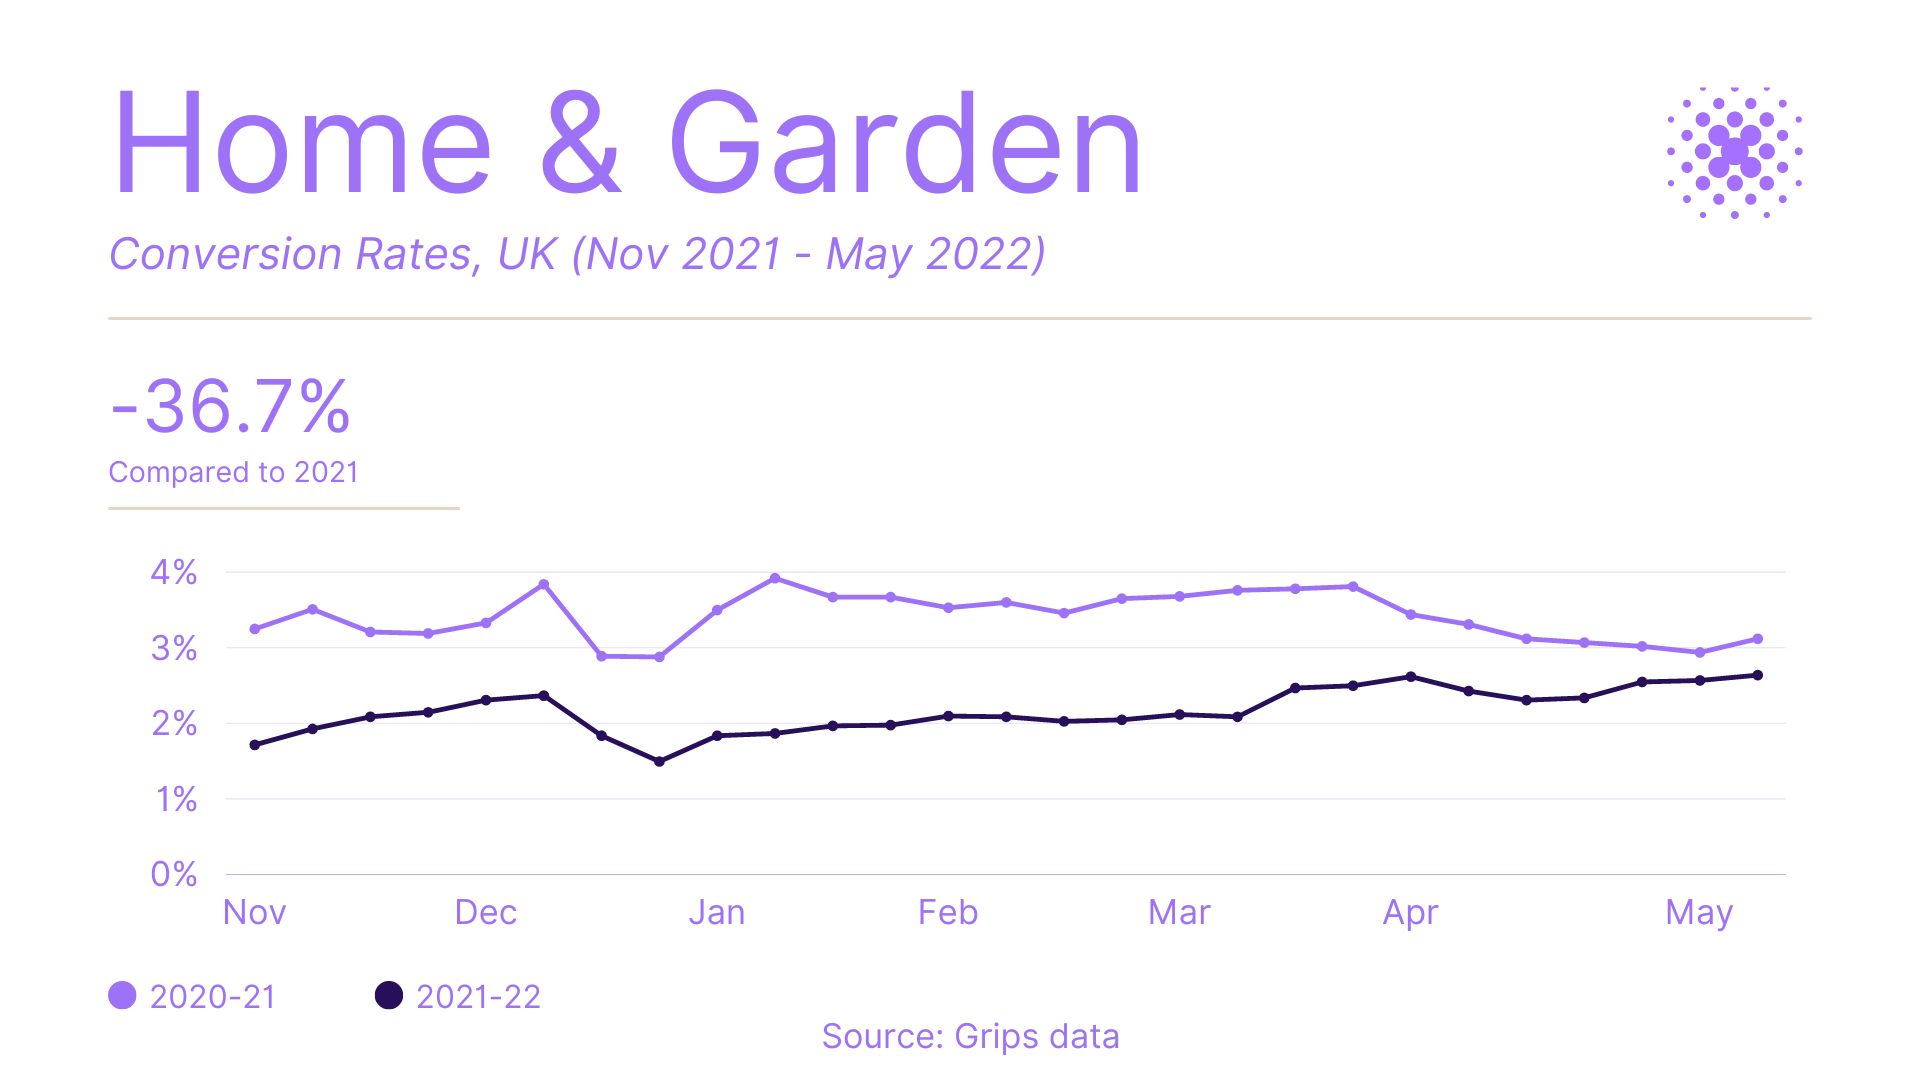
Conversion rates in the industry also decreased significantly from 3.4% to 2.2% – a 36.7% drop. However, the sector did see a higher percentage increase in AOV of 31.8%. But, with the 50% drop in Transactions, Home and Garden retailers could not mitigate such a heavy decrease.
Spending on clothes and shoes has also seen similar downward trends to Home and Garden. Whilst the AOV has increased by only a fractional percentage of 0.1%, which has seen global exchange rates fall in the industry’s favor that has helped retailers keep prices stable.
We also need to factor in that the fashion industry operates a season ahead, so the increased costs resulting from inflation, such as for raw materials, labor and transportation will not have been yet passed onto the consumer.
This will likely change in the coming months when the Autumn and Winter ranges launch later in the summer.
Transactions and Conversion Rates followed a similar trajectory to the other industries we have covered in this article. Transactions fell 11% during the period. Conversion Rates decreased 4% from 3.1% to 3% – a smaller drop when compared to Grocery, Health and Home & Garden categories.
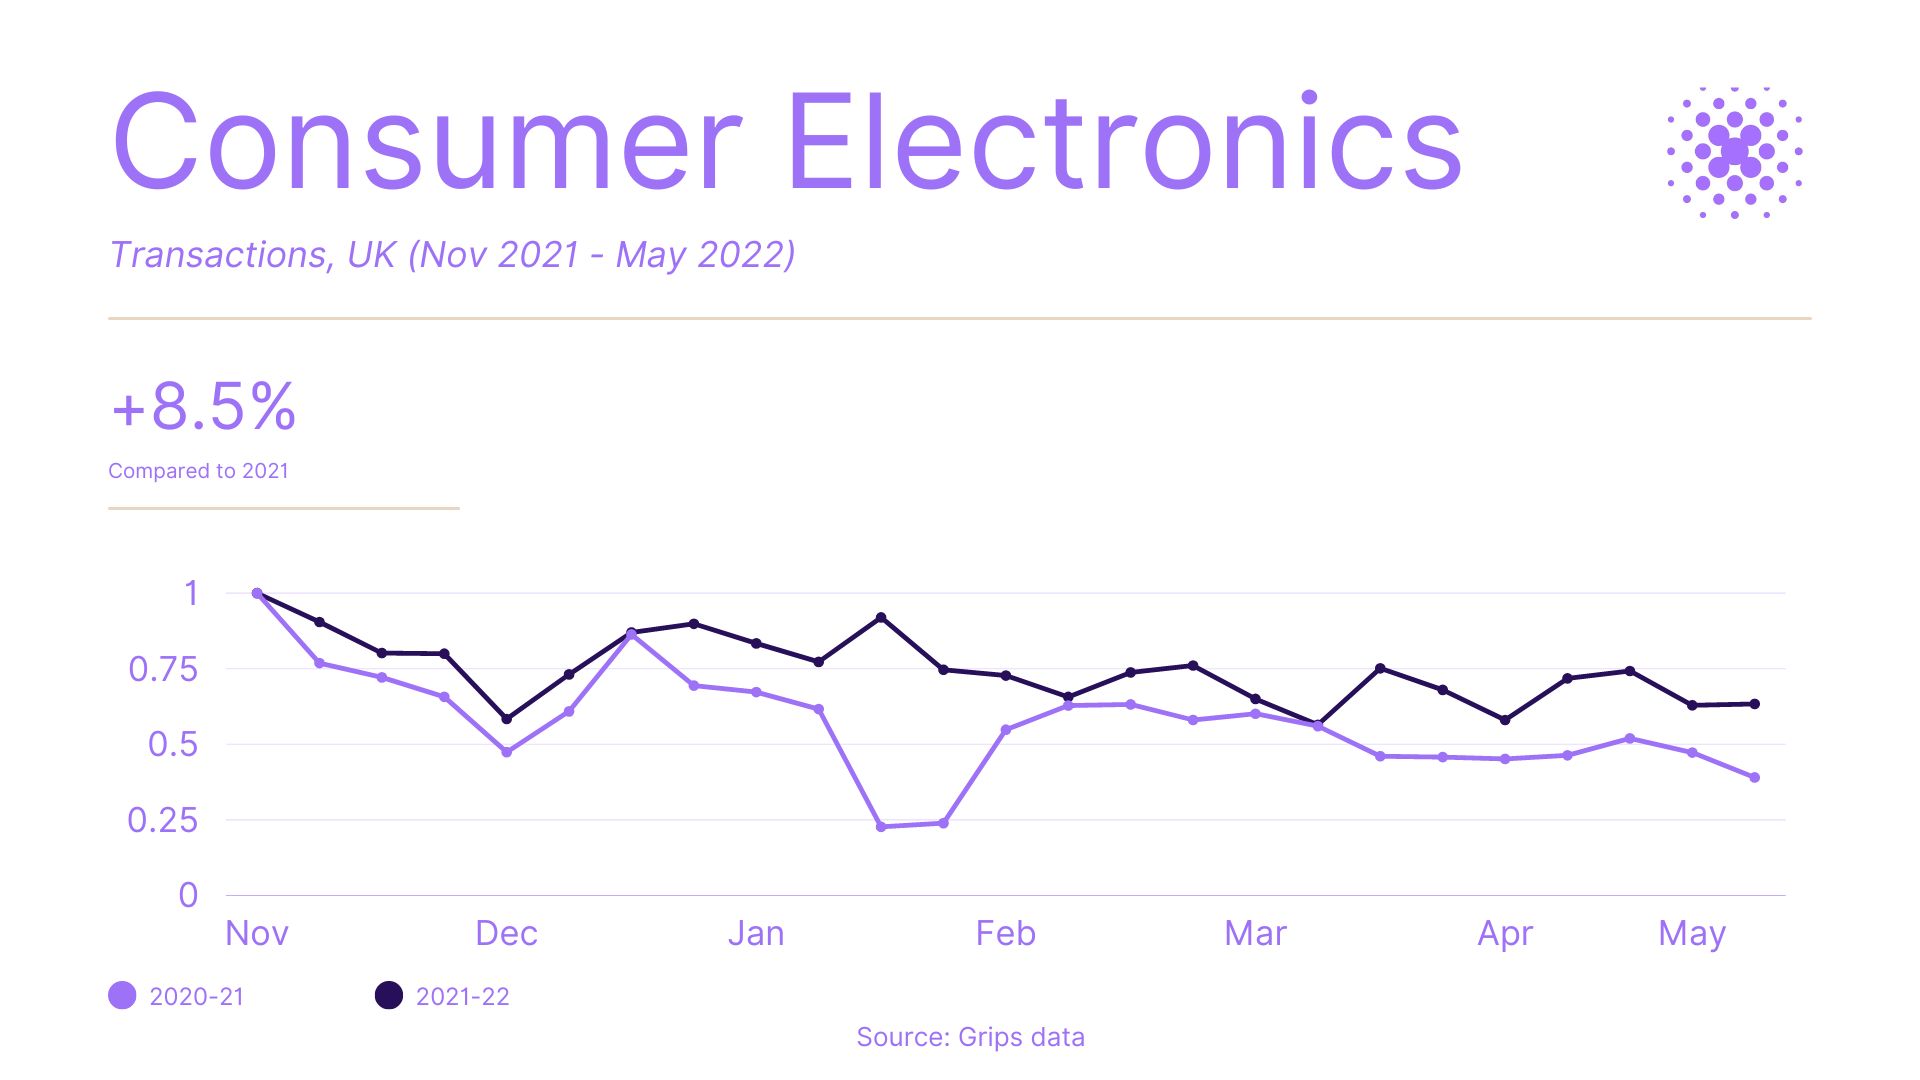
The search for discounted consumer electronics
Not all discretionary products saw such a sustained, downward trend. Consumer Electronics was one of the few industry outliers, which flipped the narrative. Perhaps, the most notable trend we saw within this industry was the huge 25% drop in AOV. This goes against the inflationary trends happening in the economy during the period.
One explanation for the AOV drop was the demand for cut-price Consumer Electronics products. As demonstrated in the chart below, we saw spikes in Transactions during periods where products are reduced or placed on sale in the country. Most notably, during the Black Friday, Cyber Monday and the post-Christmas sales period. This increased demand led to a 8.5% rise in transactions, despite a reduction in AOV.
A Travel & Tourism boom
With the UK remaining relatively open, during the Omnicron wave of Winter 2021, we have seen a Travel and Tourism boom in the country over the last six months. A trend that has seen an increase of 255% in transactions, when compared to the pre-vaccine November 2020 to May 2021 period.
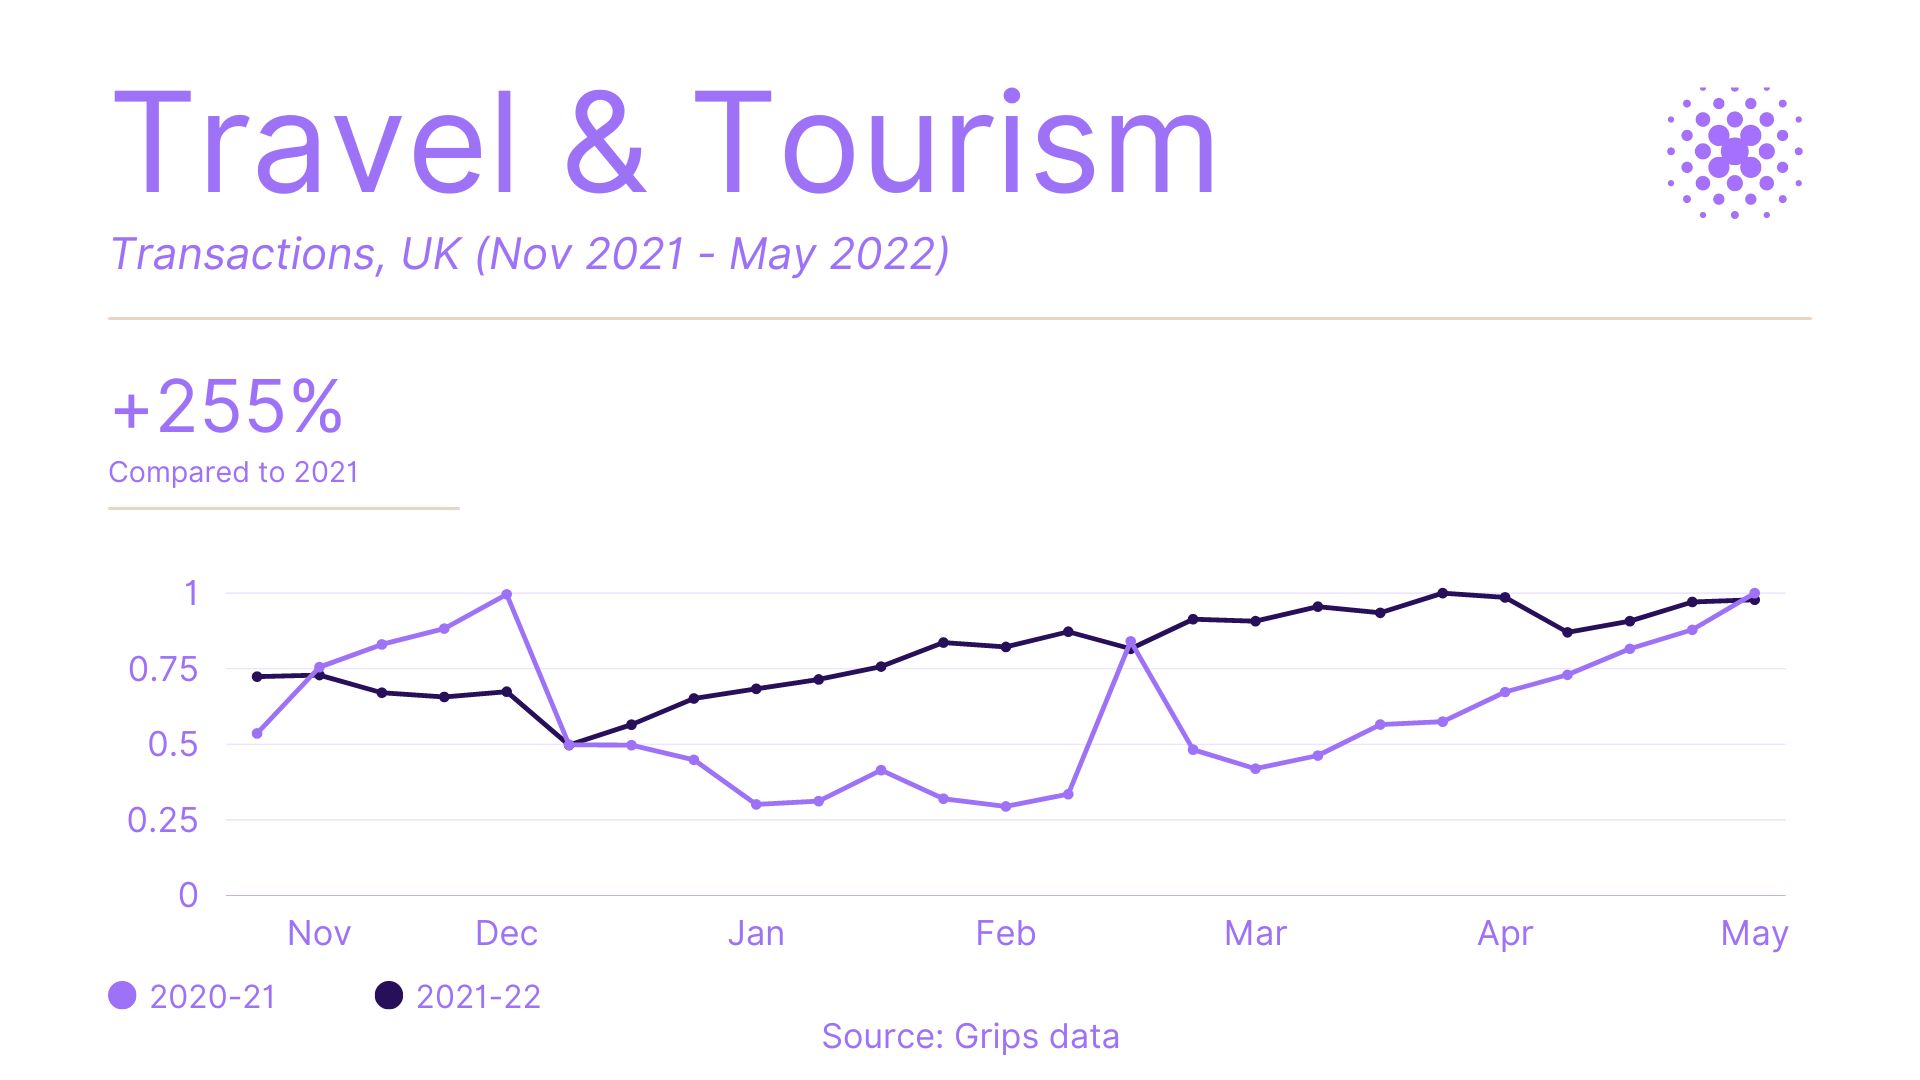
However, whilst the near threefold increase in transactions is encouraging news for companies operating in the Travel & Tourism sector. There is more to the data than meets the eye.
Similar to the trend we saw in the Consumer Electronics category, consumers are looking for travel bargains as inflationary pressures hit, combined with COVID uncertainty.
With that in mind, the AOV for the Travel & Tourism sector has decreased from $401.02 to $156.76 – a 60.9% reduction.
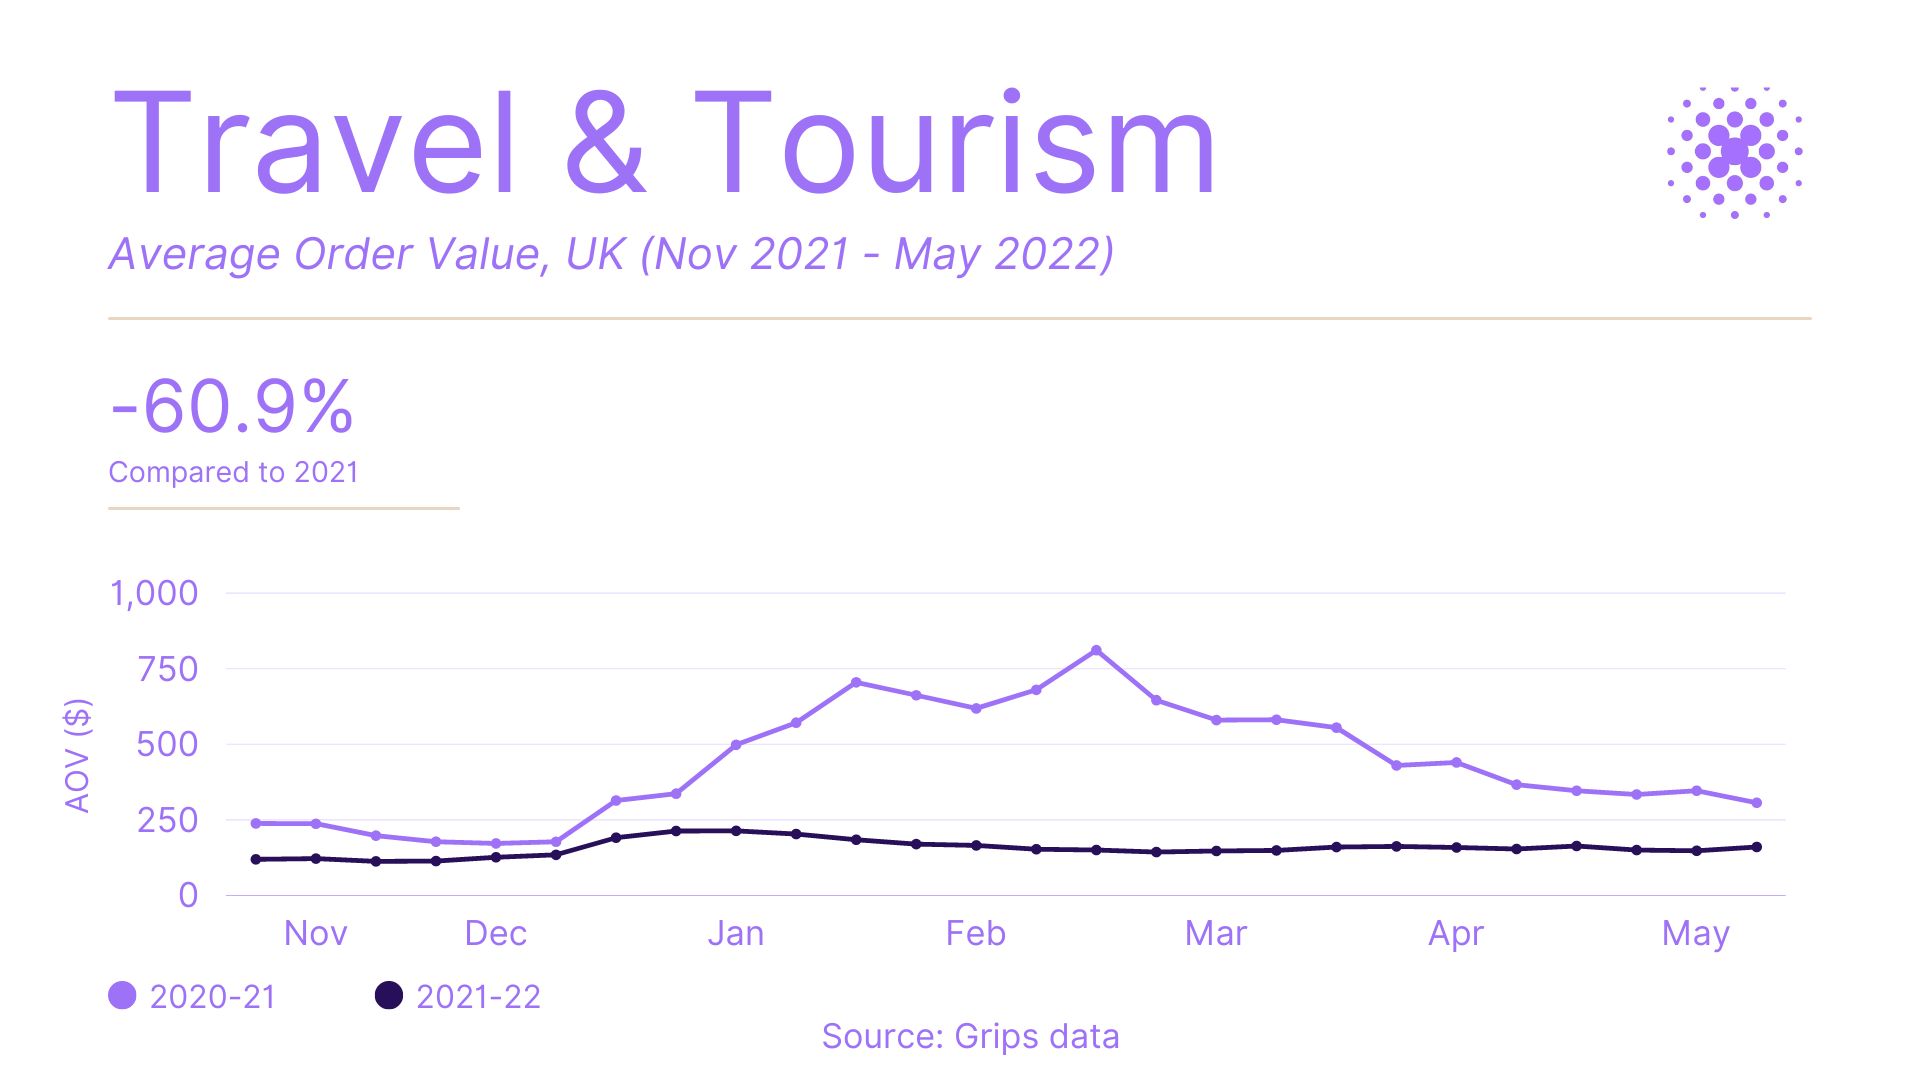
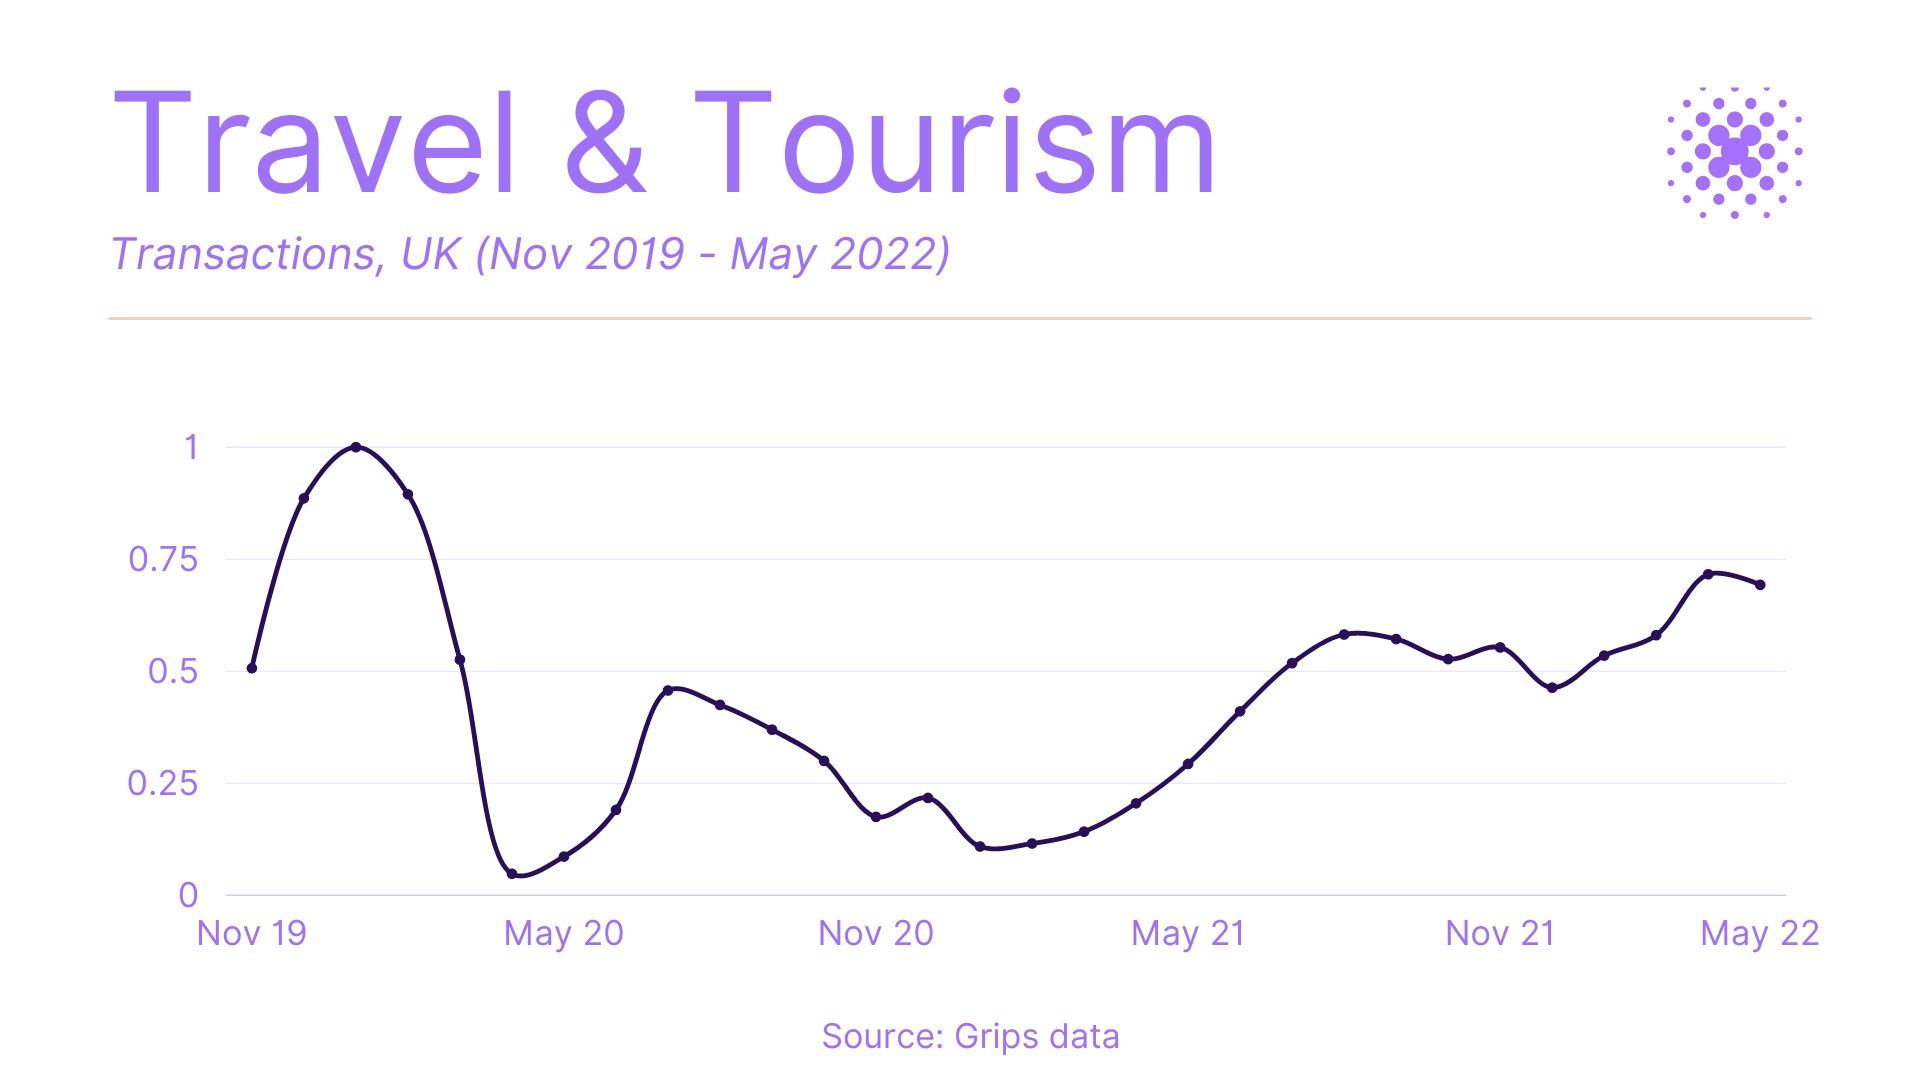
Yet with Conversion Rates growing by 111.3% and the 255% increase in transactions, the drop in AOV is not so pronounced. But, as we can see below, the impact of the pandemic on transactions has not hit pre-2020 levels. Travel & Tourism businesses will be hoping that the upward trajectory continues for some time yet.
What next?
With inflation set to hit 10% in the coming months, alongside the ongoing Ukraine-Russia conflict and 76% of Britons unhappy with the UK Government’s response to the cost-of-living crisis – the coming months will be very difficult for consumers and businesses.
Consumer spending habits have already changed for the short-term. This trend will continue for several months to come, particularly if the gap between wage rises and inflation increases further.
Unfortunately for the coming months, brands and retailers will have to play the waiting game, whilst we weather the perfect storm of inflation, supply chain disruption, reduced consumer confidence and wage stagnation.